58 Days: “Full stack” EHS reporting: a single (and consistent) source of the truth
SARA 312 Tier 2: 58 Days until deadline & counting down

Full stack definition from Oxford dictionary
“Pay me now or pay me later” 1970 Fram Oil Filter commercial
By “full stack” EHS reporting, I mean getting ALL the information about your facility activities in the previous year, processing ALL of it so that missing information, inconsistencies, and contradictions are resolved, then using this single dataset for ALL subsequent reporting for that calendar year.
With this “full stack” reporting, data will be consistent from one report to another. You will, in effect, have created one version of “the truth”.

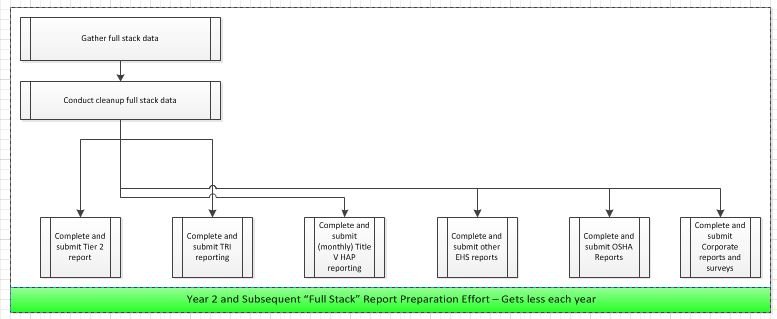
“Full Stack” Report preparation effort showing common Data Gathering and Data Cleanup activities
The first year you do this it will be a significant (maybe a quite significant) effort.
If you use the pain of that effort to implement procedures so you are receiving information automatically (automagically!) throughout the course of the next year, you will significantly reduce your pain for the following reporting year’s activities (and all subsequent years).
It is also likely that the effort for doing the actual completion of the reports will decrease, since data cleanup done one year will carry over to subsequent years.
This is especially true for Safety Data Sheet constituents, specific gravities (needed for conversion from volumentric units of measure for receipts to pounds), and health hazards.
If you continue to do “patchwork” EHS data gathering, you will repeat essentially the same effort every year. Not quite as big as going full stack the first year. Way larger than the effort for “full stack” once full stack has been automated (or semi-automated)

“Patchwork” approach to Environmental, Health and Safety Report Preparation, each report is its own stand-alone effort
You might also wind up repeating some of your efforts from earlier reports as you go from report to report, since you may find that some of the information might need some additional detail.
There is also a high likelihood for inconsistency between the reports.
And data cleanup for a later report has a significant probability of unearthing data that was missing from a previous report that should have been included.
Call to the community:
What are the size of your “boxes” on the charts above? Can you measure them this year to get a baseline metric
If you would like the above Visio diagrams, into which you can have your metrics automatically display from an Excel spreadsheet, reach out to me!
More tomorrow, here’s to Mar 2nd!